THE WEATHER THAT WE WATCH


In this project we share information about the weather in the areas where we live. We make some weather charts / maps of our territories. Students are encouraged to watch the weather , to get information of it in the papers ( forecasts) and to use some instruments to measure it (thermometer , barometer, hygrometer , anemometer, pluviometer… ) . They write down the results in some charts/maps to share them every period of time . They interchange photos/drawings and descriptions too . Different digital tools are used to share these works.

Friday 9 December 2016

WEATHER CHART . CEIP MONTEL TOUZET. A CORUÑA

We collected  some data   in my school  ,   using different devices and information sources from  5TH DECEMBER TO 9TH DECEMBER
             The way that we collected the information was by  a thermometer in the playground and a barometer-hygrometer in a corridor of the school. The other data were
by a weather  web  page . 

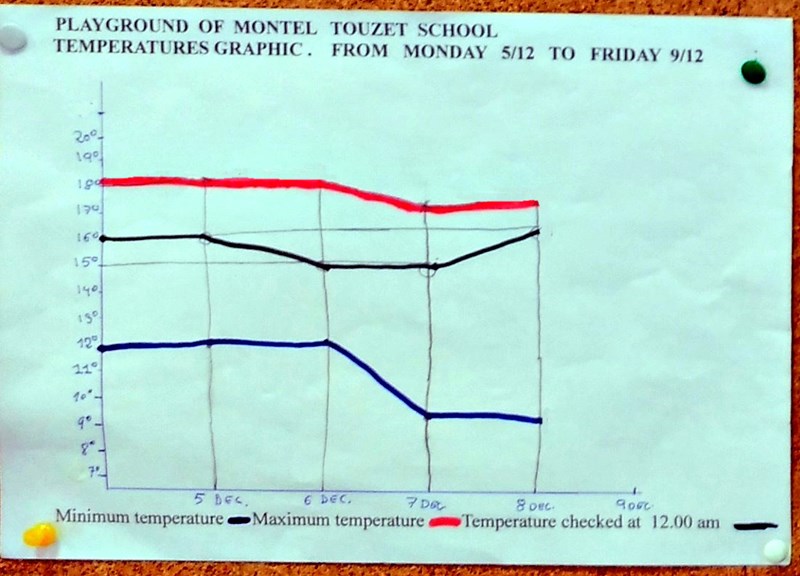
    This is a poster with a  weather chart  .  It ´s a work for  the school  . It´s in located in a corridor 


This  is a  chart located in my classroom ( 5th lvel PRIMARY)  . It´s   with a graphic with maximum , minimum, and  temperature checked  at  12.00 .


No comments:

Post a Comment

Note: only a member of this blog may post a comment.